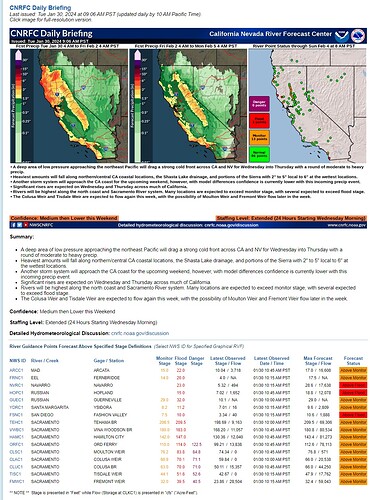
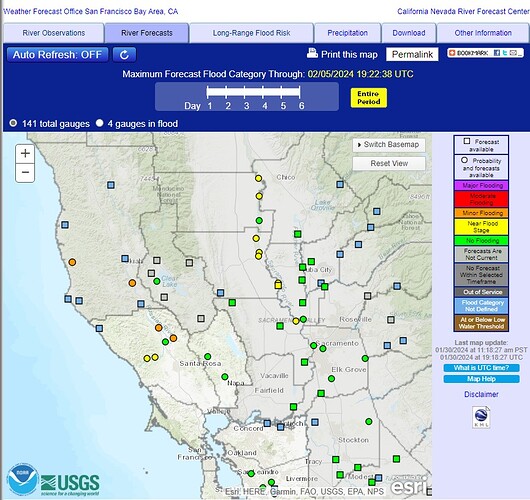
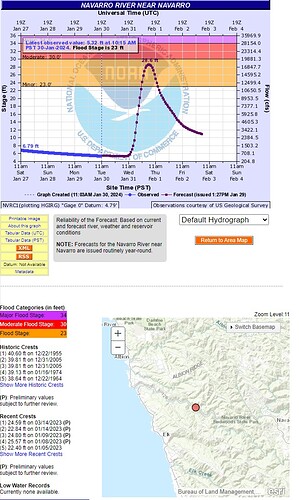
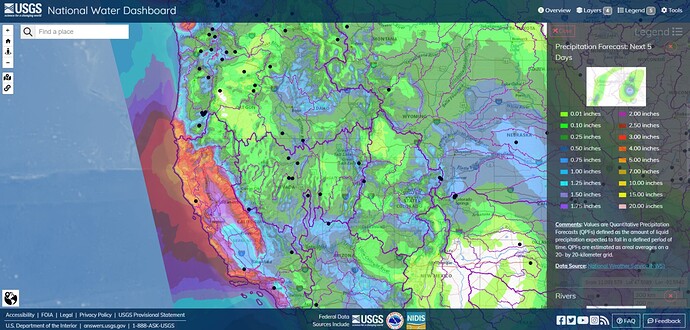
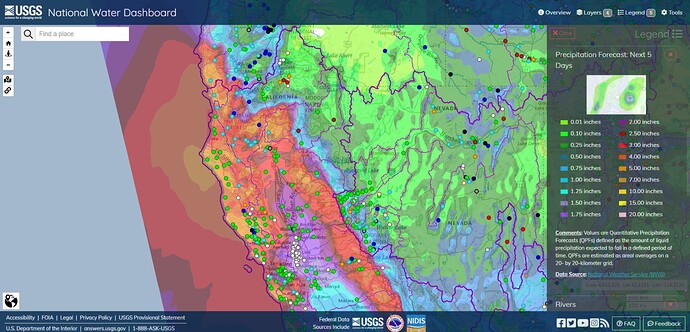
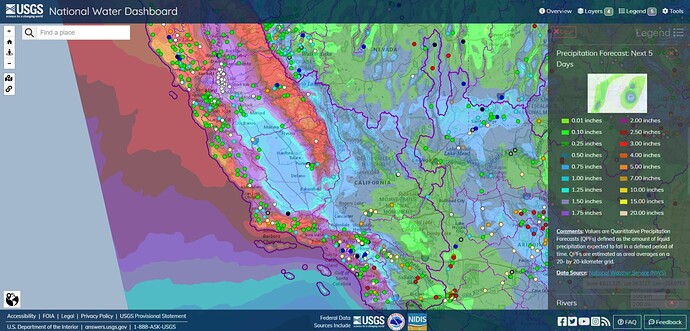
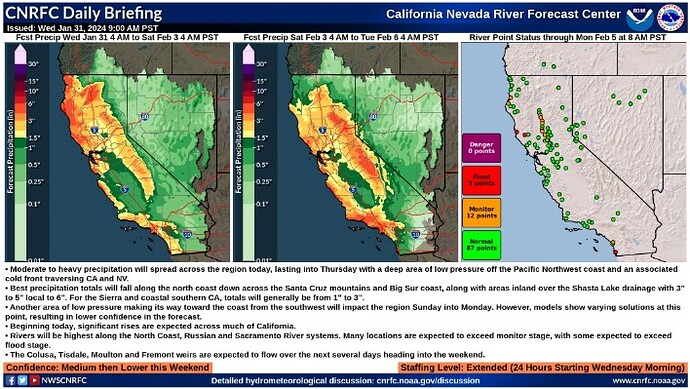
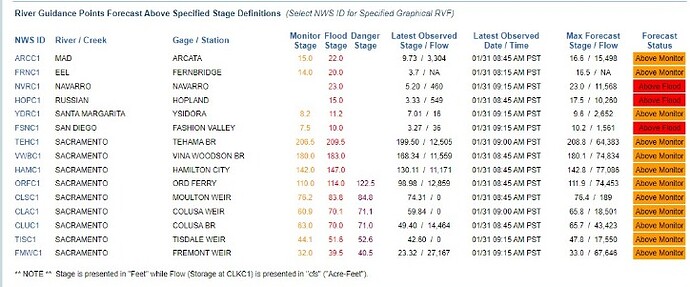
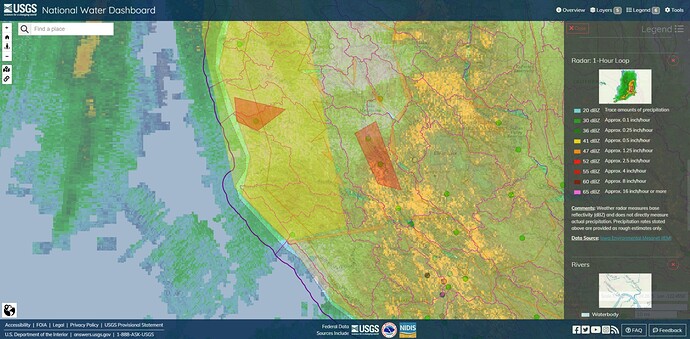
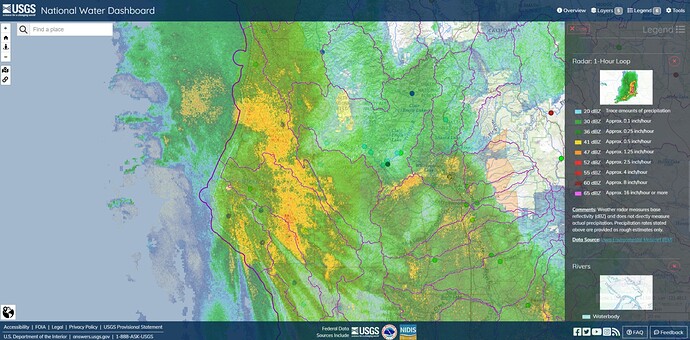
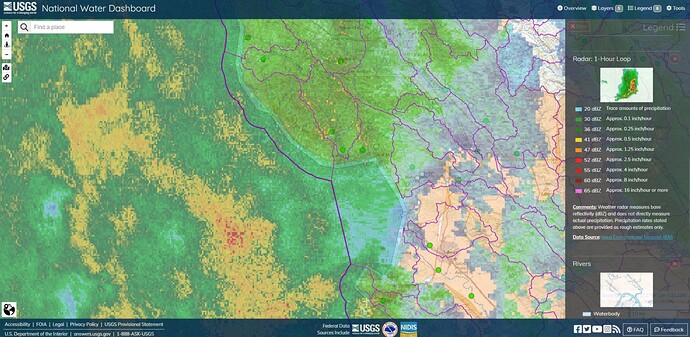
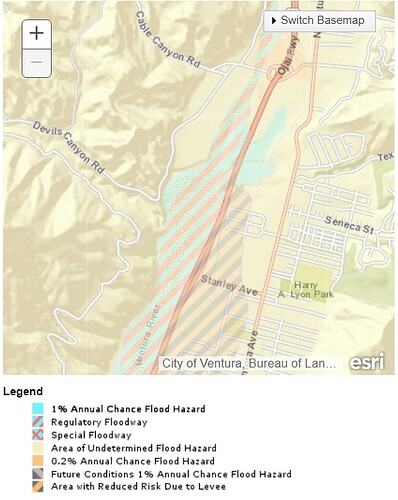
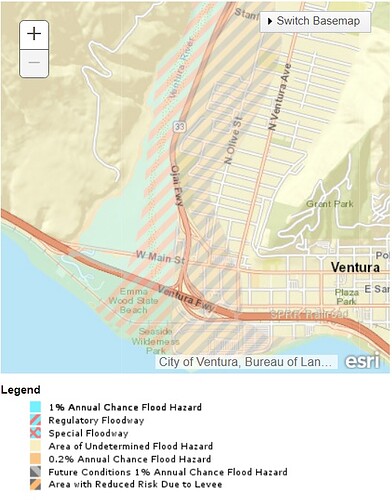
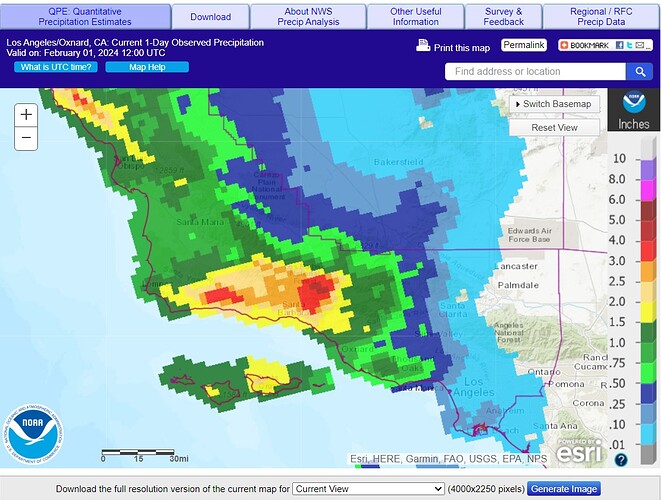
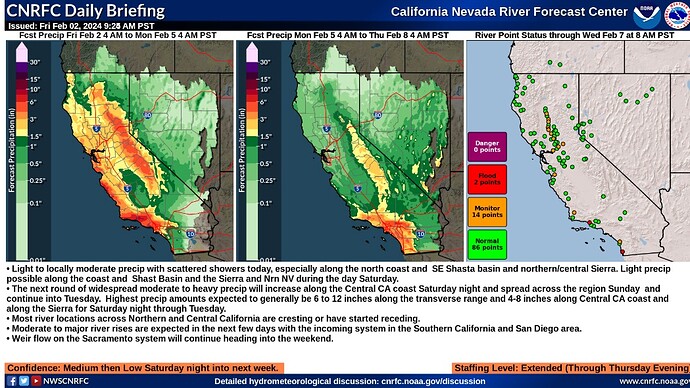
I gotta tell ya, dude, I have no clue how to recreate what USGS land and sea does to zoom the watershed definition datagraph value that changes the polygon with scroll altitude, or what REST message its sending, or what pull its doing with java voodoo. I was in Natural Resources, not the five json magics. Challenging, maybe somebody in TAK world is looking at it.
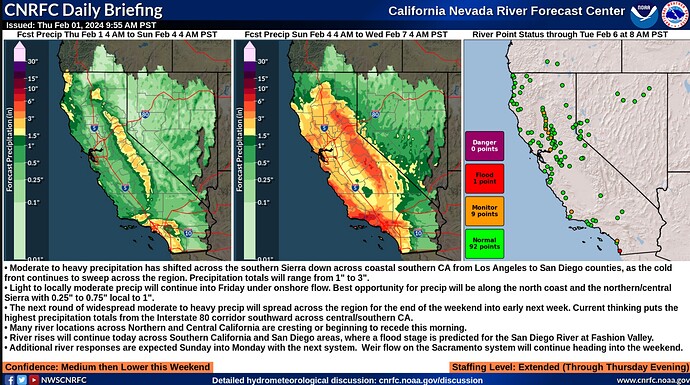
I feel like the easy way is to choose the most relevant watershed detail altitude as a single plane, in particular; the plane that aligns with NWS Watch and Warning polygons. See how that jibes with what you see with your Mk 1s. Use that KML layer in TAK. Feds have stacks of flood data and PDFs, I don’t imagine all of them are as plug and play as geolocated IAPs. Some of them might be. Some of them might be on Fed ArcGIS servers.
You need to keep it simple. You’re not underwriting an annual insurance estimate. You’re responding to an incident.
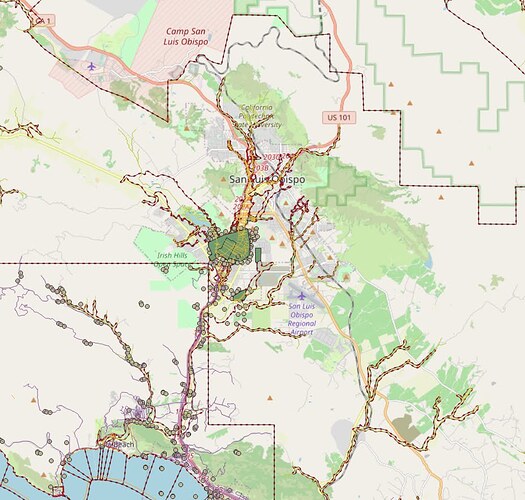
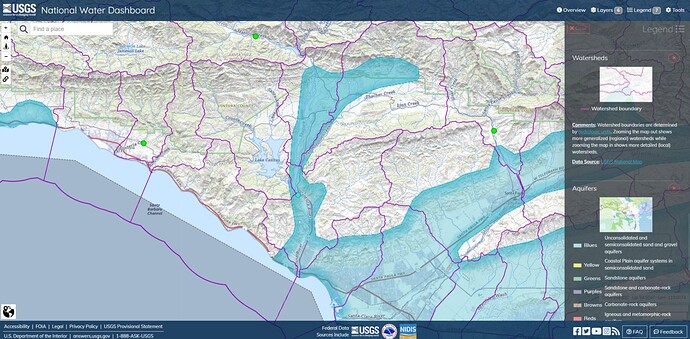
Ex. Last year, I used this map to evaluate the creeks around Camp SLO and the joint CalFire/CCC Toro Fire Center, located by the RC airstrip in the upper left. SLU has a TAK pilot, IIRC. As you mentioned, about NOAA, they move the racks around at the FEMA library.
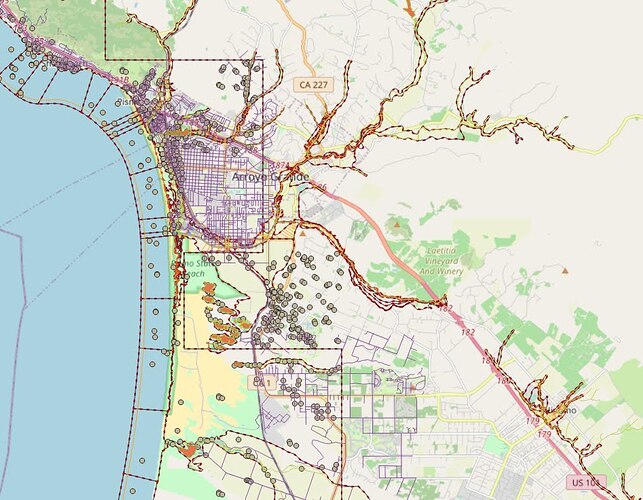
Arroyo Grande Creek (of LPF Hotshots fame) and Oceano had flooding issues that tracked pretty closely to this map I hooked out of the Big Library.
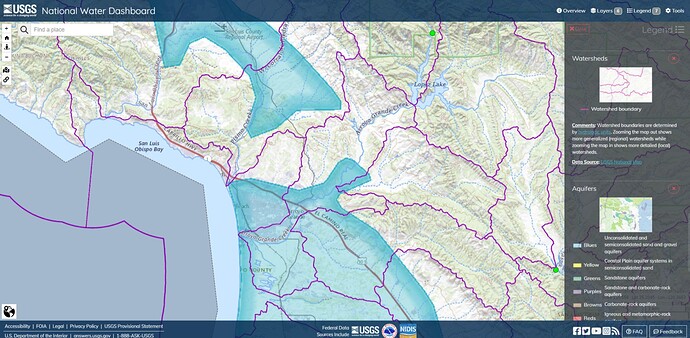
Arroyo Grande Creek Watershed and Aquifers.
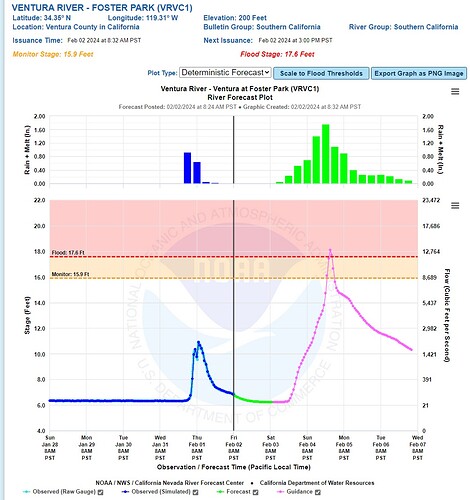
Ventura River Watershed and Aquifers. The bottom of the Ventura carries three large drainages that fall downwards to the beach.

