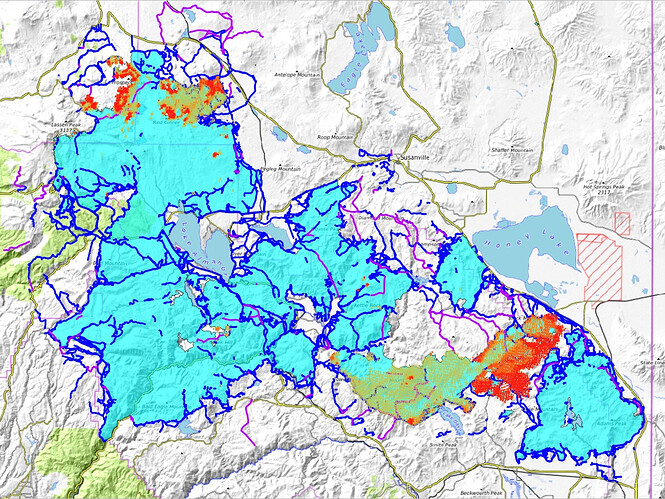
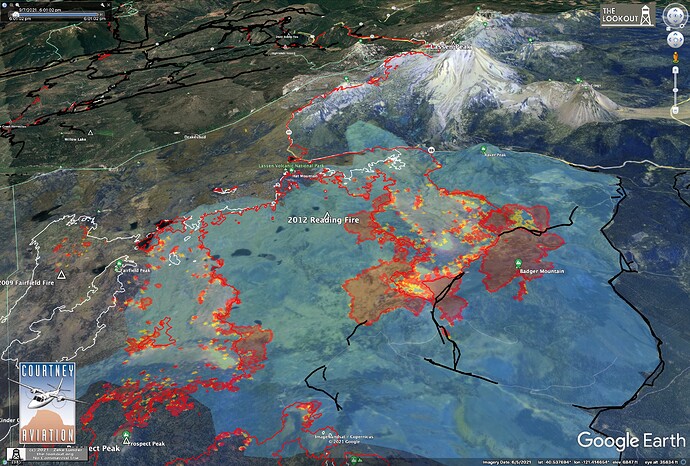
Latest VIIRS along with some of today’s data package:
Red dots = Detection last 24 hours.
Dark Orange dots = Detection Last 48 hours.
Light Orange dots = Detection Last 72 hours.
Cyan = Fire Perimeter. Note that the Beckwourth Complex is included at lower right.
Dark Blue lines = Completed All Types Of Line.
Purple lines = Planned All Types Of Line.
OK Can’t post three in a row, so here’s my 2nd post in a row edited with new KML files…
KML files filtered from 20210906 data package found here:
https://ftp.wildfire.gov/public/incident_specific_data/calif_n/!CALFIRE/!2021_Incidents/CA-BTU-009205_Dixie/GIS/IncidentData/20210906/
For import into CalTopo, Google Earth, etc. Can’t vouch for how accurate they keep the data vs what’s really on the ground.
Completed Dozer Line. There are 3650 entries vs 3577 yesterday:
Completed All Type Of Line. There are 4775 entries vs 4667 yesterday:
Planned All Type Of Line. There are 152 entries vs 151 yesterday:
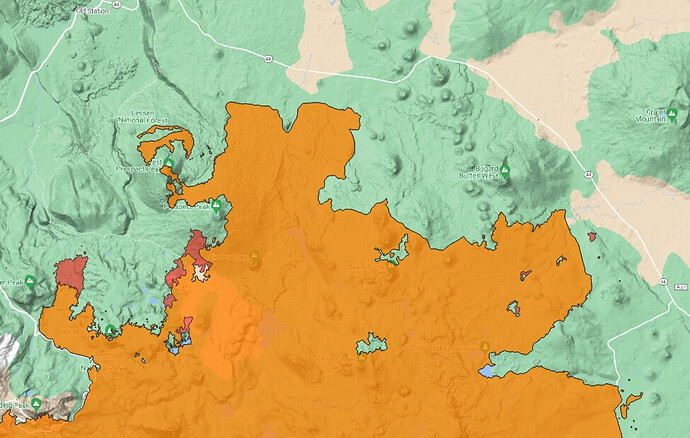
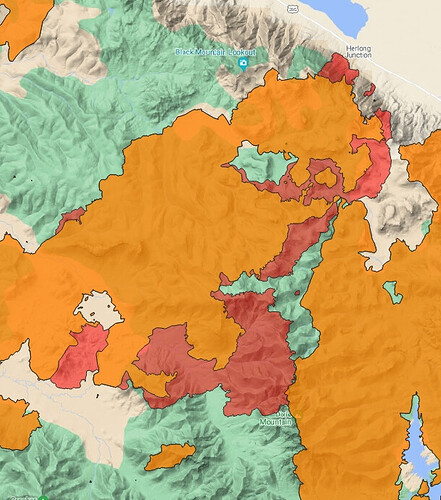
Fire spread 09/05 vs 09/06.
Orange = 09/05 perimeter.
Red = 09/06 new growth.
Old Station/44 area:
East end:
===============================================
KML files filtered from 20210907 data package found here:
https://ftp.wildfire.gov/public/incident_specific_data/calif_n/!CALFIRE/!2021_Incidents/CA-BTU-009205_Dixie/GIS/IncidentData/20210907/
For import into CalTopo, Google Earth, etc. Can’t vouch for how accurate they keep the data vs what’s really on the ground.
Completed Dozer Line. There are 3705 entries vs 3650 yesterday:
Completed All Type Of Line. There are 4854 entries vs 4775 yesterday:
Planned All Type Of Line. There are 148 entries vs 152 yesterday:
Here’s a new one. Entries tagged as ‘Contained Line’. 75 entries.

